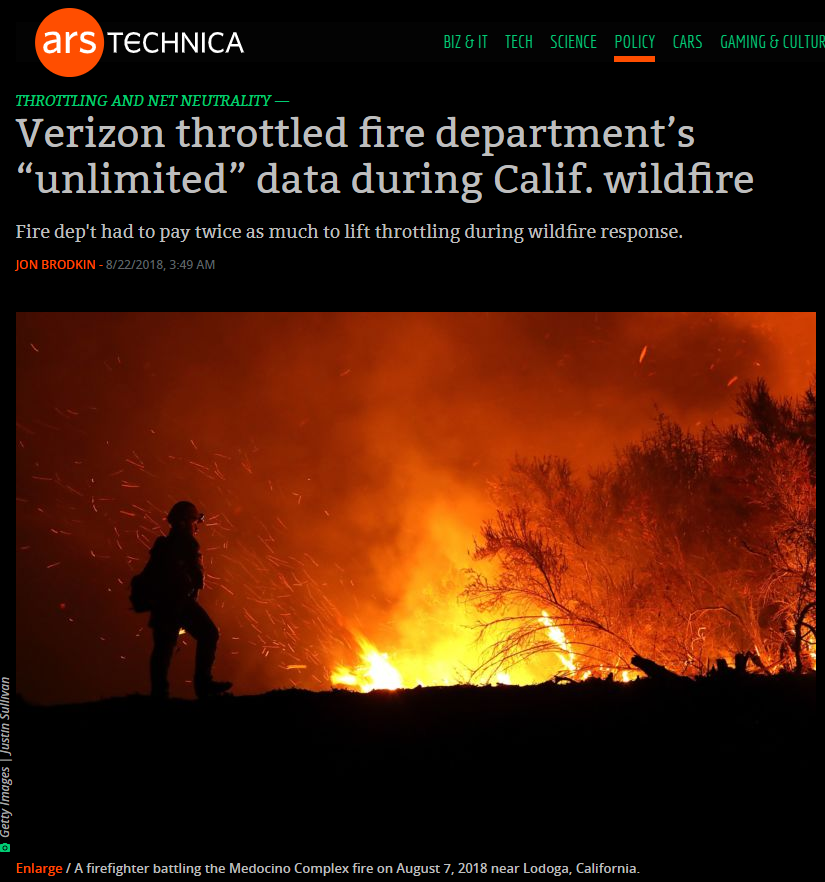
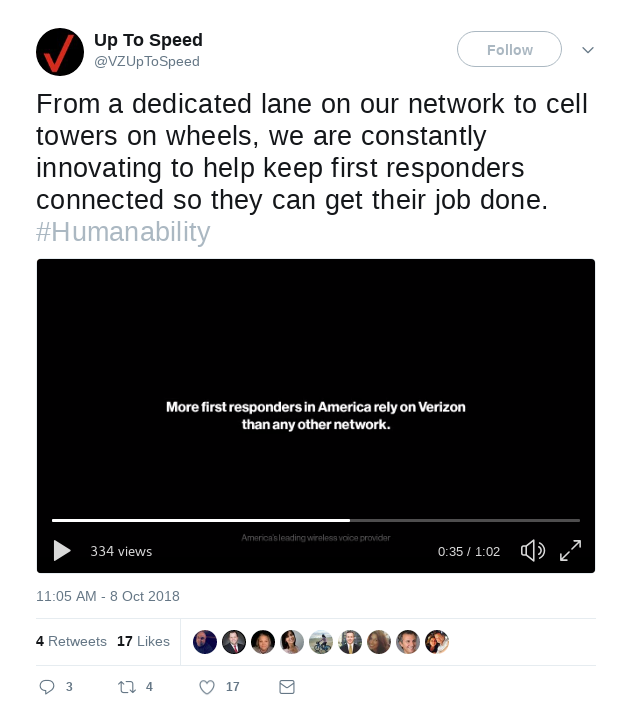
Text analytics and accounting: Social media and fraud detection


2019 July 26


Dr. Richard M. Crowley
SMU School of Accountancy

rcrowley@smu.edu.sg \cdot @prof_rmc

Using Twitter for accounting research

Various papers with Hai Lu and Wenli Huang

What we’re working with

  • Every tweet by every S&P 1500 firm + CEO + CFO
  • Data from 2011 to right now

>28 million tweets

When do companies tweet about financials?

How do companies tweet about CSR?

Greenwashing

Do markets care more about firms’ or executives’ tweets?

Fraud detection using 10-K topics

Brown, Crowley and Elliott 2019 (on SSRN)

The problem

How can we detect if a firm is currently involved in a major instance of misreporting?

Why do we care?

  • 10 most expensive US corporate frauds cost shareholders 12.85B USD
  • The above, based on Audit Analytics, ignores:
    • GDP impacts: Enron’s collapse cost ~35B USD
    • Societal costs: Lost jobs, economic confidence
    • Any negative externalities, e.g. compliance costs
    • Inflation: In current dollars it is even higher

Catching even 1 more of these as they happen could save billions of dollars

Misreporting: A simple definition

Errors that affect firms’ accounting statements or disclosures which were done seemingly intentionally by management or other employees at the firm.

  • Traditional misreporting
    1. A company is underperforming
    2. Management cooks up some scheme to increase earnings
      • Wells Fargo (2011-2018?)
    3. Create accounting statements using the fake information

Where are we at?

Fraud happens in many ways, for many reasons

  • All of them are important to capture
  • All of them affect accounting numbers differently
  • None of the individual methods are frequent…

It is disclosed in many places. All have subtly different meanings and implications

  • We need to be careful here (or check multiple sources)

This is a hard problem!

The BCE model

  1. Retain 17 financial and 20 style variables from the previous models
    • Forms a useful baseline
  2. Add in an ML measure quantifying how much each annual report (~20-300 pages) talks about different topics

Why do we do this? — Think like a fraudster!

  • From communications and psychology:
    • When people are trying to deceive others, what they say is carefully picked – topics chosen are intentional
  • Putting this in a business context:
    • If you are manipulating inventory, you don’t talk about inventory

How to do this: LDA

  • LDA: Latent Dirichlet Allocation
    • Widely-used in linguistics and information retrieval
      • Available in C, C++, Python, Mathematica, Java, R, Hadoop, …
      • Gensim is great for python; STM is great for R
    • Used by Google and Bing to optimize internet searches
    • Used by Twitter and NYT for recommendations
  • LDA reads documents all on its own! You just have to tell it how many topics to find

Main results

End matter


Thanks!


Dr. Richard M. Crowley
SMU School of Accountancy

rcrowley@smu.edu.sg \cdot @prof_rmc
Web: rmc.link

To learn more:

  • More advanced slides for the fraud detection work are available at rmc.link/DSSG
  • Technical details publicly available at SSRN for both papers
  • Plenty more information on my website at rmc.link

Experimental design

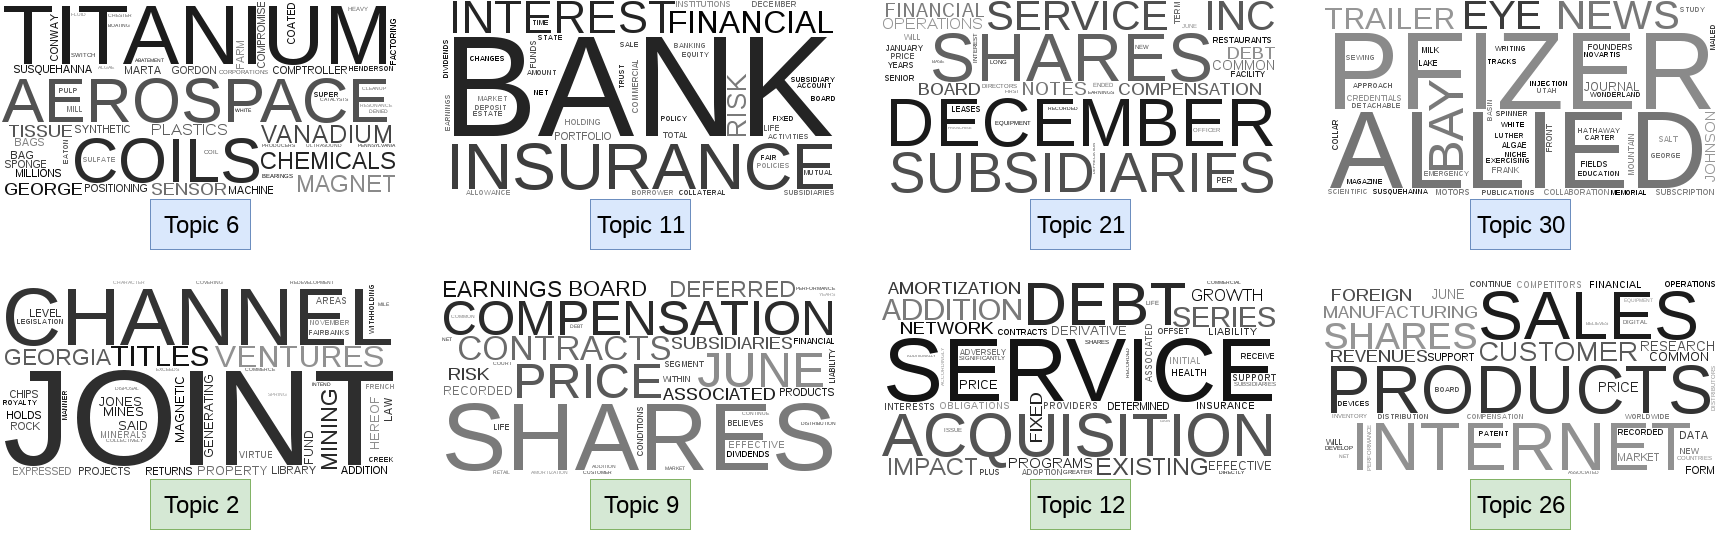
Instrument: A word intrusion task

  • Which word doesn’t belong?
  1. Commodity, Bank, Gold, Mining
  2. Aircraft, Pharmaceutical, Drug, Manufacturing
  3. Collateral, Iowa, Residential, Adjustable

Participants

  • 100 individuals on Amazon Turk (20 questions each)
    • Human but not specialized

Quasi-experimental design

  • 3 Computer algorithms (>10M questions each)
    • Not human but specialized
    1. GloVe on general website content
      • Less specific but more broad
    2. Word2vec trained on Wall Street Journal articles
      • More specific, business oriented
    3. Word2vec directly on annual reports
      • Most specific

These learn the “meaning” of words in a given context

Run the exact same experiment as on humans

Experimental results

Some other interesting results

Case studies

  • Prediction scores for 1999 ranked in the 98th percentile
    • First publicized in 2001
  • Increases in Income topic and firm size are the biggest red flags


  • Prediction scores for 2004 through 2009 rank 97th percentile or higher each year
    • AAER published in 2011
  • Media and Digital Services topics are the red flags

Financial model

  • Log of assets
  • Total accruals
  • % change in A/R
  • % change in inventory
  • % soft assets
  • % change in sales from cash
  • % change in ROA
  • Indicator for stock/bond issuance
  • Indicator for operating leases
  • BV equity / MV equity
  • Lag of stock return minus value weighted market return
  • Below are BCE’s additions
  • Indicator for mergers
  • Indicator for Big N auditor
  • Indicator for medium size auditor
  • Total financing raised
  • Net amount of new capital raised
  • Indicator for restructuring

Based on Dechow, Ge, Larson and Sloan (2011)

Style model (late 2000s/early 2010s)

  • Log of # of bullet points + 1
  • # of characters in file header
  • # of excess newlines
  • Amount of html tags
  • Length of cleaned file, characters
  • Mean sentence length, words
  • S.D. of word length
  • S.D. of paragraph length (sentences)
  • Word choice variation
  • Readability
    • Coleman Liau Index
    • Fog Index
  • % active voice sentences
  • % passive voice sentences
  • # of all cap words
  • # of “!”
  • # of “?”

From a variety of research papers