ACCT 101: Financial Statement Analysis
Session 11
Dr. Richard M. Crowley
Frontmatter
Final exam details
- The exam will be done electronically on eLearn. Students in Singapore will take the exam at SMU; students abroad will take the exam simultaneously.
- 8 questions that consist of problem solving, journal entries, reasoning & explanations, preparation of partial or full statements, and financial statement analysis (including ratios). PV/PVA tables will be given (for bonds).
- These are comprehensive questions that integrate several topics. The following topics will be covered:
- Accounts receivable and bad debt
- Bank reconciliation
- Inventory and COGS
- Long term assets
- Accrual accounting: processing information & adjusting
- Liabilities
- Stockholders’ equity
- Statement of cash flows
- Financial ratios
- Ratios: you must use the formulas in these lecture slides. Formulas will not be provided in the exam papers.
- Not covered: Par value for common shares; periodic inventory systems
- Use sample (past year) exam papers with caution. The content, coverage, and difficulty level may be different.
Final exam resources
- Practice final exams
- These are old exams which I have made annotations to in order to keep them relevant
- Additional practices
- Additional selected book problems
- Review session by TAs
- In mid-to-late November
- Office hours – book online!
- eLearn practices (257 questions and counting!)
- These can be very helpful to identify what you need to study
- All practices from quiz 1 and quiz 2
Final exam tips
- Remember that everyone is taking the same exam – if you find it difficult or long, others likely think the same.
- If you are stuck on a question, skip it and come back later. It’s better to solve everything that you know well and then work on those you are stuck on.
- If you are really stuck on a topic while studying for finals, drop by my office hours and we’ll get it worked out.
- Course grades will be curved.
Learning objectives
- Learn about financial statement analysis
- Calculate and interpret financial ratios
Financial statement analysis
What matters?
- The business environment
- Economy health
- Other countries (particularly for multinational firms)
- Industry demand
- Resource scarcity or supplier concentration
- Consumer concentration
What matters?
- Historical financials
- Financial statements and notes
- Competitors statements

What matters?
- Historical non-financials
- Governance, Risk disclosures, Audit report
- Shareholders, supplier relationships


Predicting firm value
- Trend analysis (a.k.a. Horizontal analysis)
- Compare dollar and percent changes across years
- Common size financial statements (a.k.a. Vertical analysis)
- Compare financials across years or firms
- A subset of ratio analysis
- Ratio analysis
- Analytics
Only ratio analysis is on the final – we’ll cover the others briefly.
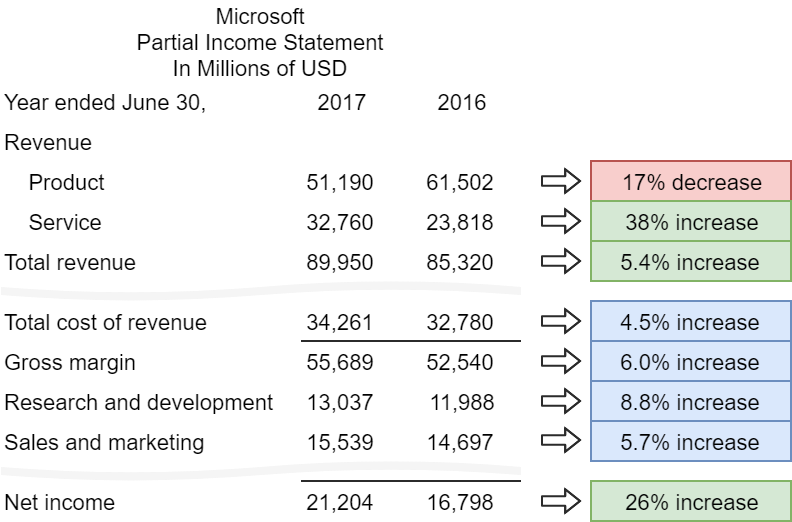
Trend analysis
What is it?
- Comparing different years or quarters of data to see the trend in measures.
- Examples:
- Revenue grew by 3% this year
- Net income grew by 4% this quarter
- Quarterly revenue decreased 2% year over year
Examples
That is a reflection of a strong quarter: Nike reported earnings of 68 cents a share, beating analysts’ estimates by 15 cents, and grew revenue by 7%.
The plans emerged as the Shenzhen-based company said its fourth-quarter revenue grew 51% year over year to 66.4 billion yuan ($10.2 billion), boosted by strong growth in mobile payments, digital content subscriptions and advertising on its flagship mobile social apps, WeChat and QQ.
How to do it
- Get 2 financial statements from the same company (typically the income statement)
- Find the percentage change from the old figures to the new figures
Common-size financial statements
What is it?
- Standardizing figures in a financial statement by dividing by another figure.
- Allows for comparing finanical statements accross companies
- Ex.:
- Divide an income statement by revenue
- \(\frac{Gross\ profit}{Revenue}=Gross\ Margin\)
- \(\frac{Net\ income}{Revenue}=Profit\ Margin\)
- Divide financial statements by total assets
- Divide an income statement by revenue
Examples
Fourteen of the last 15 packaged food makers to [report] earnings posted lower-than-expected gross margins, said J.P. Morgan analyst Ken Goldman.
The company is forecasting an 8% global profit margin by about 2022, a number that would put it closer to better-performing peers, including GM. Ford’s 5% operating margin last year was disappointing…
How to do it
- Get a financial statement
- Divide every number by the same amount (sales, total assets, etc.) to get the percent (of sales, of assets, etc.)
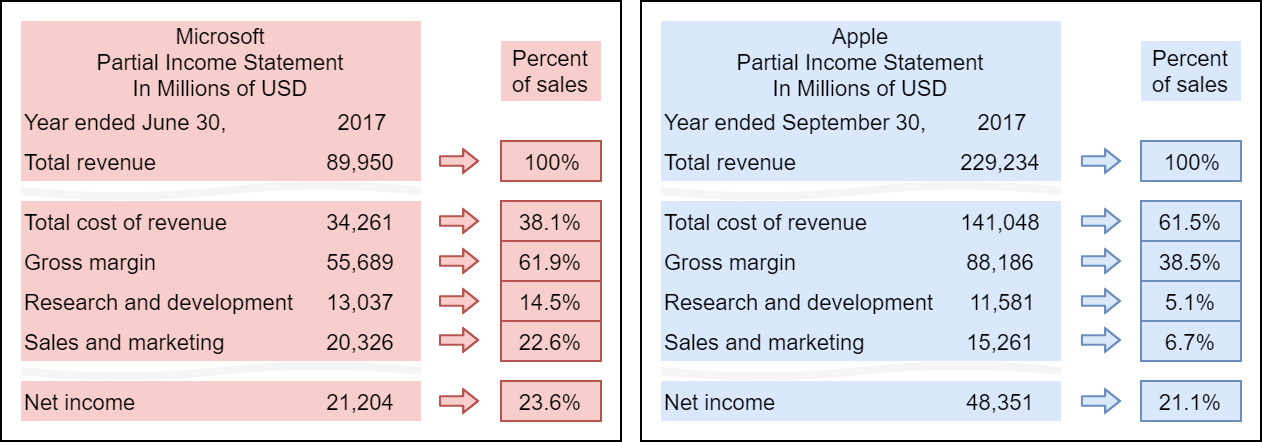
We can compare accross companies or years
Balance sheet ratios
What is ratio analysis?
- Using various ratios of numbers from financial statements to better understand companies
All examples use the following data
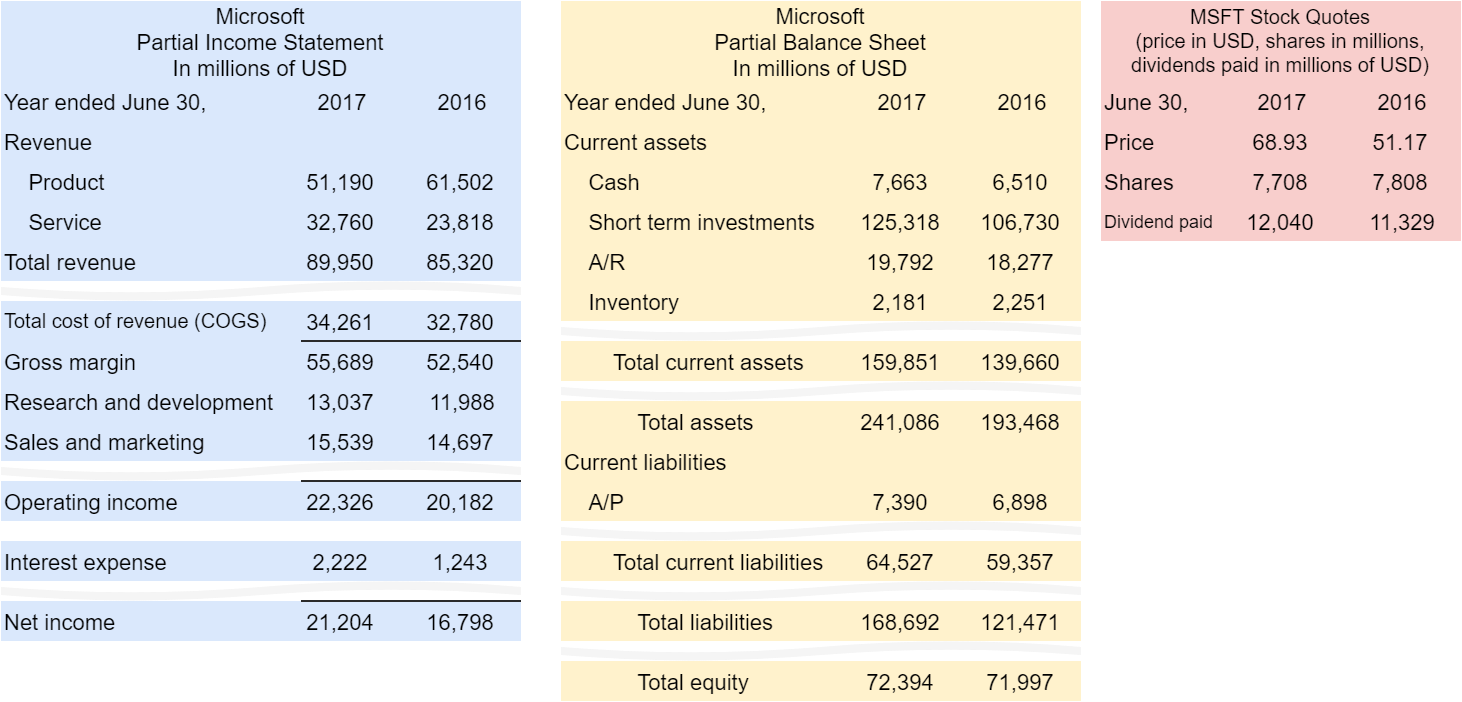
Caveats
- There are a few differences between the ratios in these slides and in the book. These differences are due to simplifications I have made – you can use these ratios on the final instead of the book’s ratios without penalty.
- Some ratios have many definitions. If you look online, you may find other definitions for some of these ratios. Don’t use those on the final.
Inventory turnover
\[ \frac{COGS}{\frac{1}{2}\left(Inventory_T + Inventory_{T-1}\right)} \]
- How many times per year a company sells its inventory on hand
- A similar measure is Inventory resident period
- A.k.a. Number of days’ sales in inventory
- Calculated as \(\frac{365}{Inventory\ turnover}\)
- The number of days it take to sell the company’s inventory
Microsoft’s 2017 inv. turnover: \(\frac{34,261}{\frac{1}{2}\left(2,181 + 2,251\right)} = 15.46\)
Microsoft’s 2017 inv. period: \(\frac{365}{15.46}=23.6\ days\)
Accounts receivable turnover
\[ \frac{Revenue}{\frac{1}{2}\left(A/R_T + A/R_{T-1}\right)} \]
- How many times per year a company collects its A/R on hand
- A similar measure is Receivable collection period
- A.k.a. Number of days’ sales in receivables
- Calculated as \(\frac{365}{Accounts\ receivable\ turnover}\)
- The number of days it take to collect the company’s A/R
Microsoft’s 2017 A/R turnover: \(\frac{89,950}{\frac{1}{2}\left(19,792 + 18,277\right)} = 4.73\)
Microsoft’s 2017 A/R period: \(\frac{365}{4.73}=77.2\ days\)
Payable turnover
\[ \frac{COGS}{\frac{1}{2}\left(A/P_T + A/P_{T-1}\right)} \]
- How many times per year a company pays its A/P it owes
- A similar measure is Payable outstanding period
- Calculated as \(\frac{365}{Payable\ turnover}\)
- The number of days it take to pay the company’s A/P
Microsoft’s 2017 A/P turnover: \(\frac{34,261}{\frac{1}{2}\left(7,390 + 6,898\right)} = 4.80\)
Microsoft’s 2017 A/P period: \(\frac{365}{4.80}=76.1\ days\)
Cash conversion cycle
\[ \begin{equation*} \frac{365}{Inventory\ turnover} + \frac{365}{A/R\ turnover} - \frac{365}{A/P\ turnover}\\ \Updownarrow\\ \scriptstyle Receivable\ collection\ period + Inventory\ resident\ period - Payable\ outstanding\ period \end{equation*} \]
- Measures how long it takes to convert inventory to cash, less time to pay payables
- Time from paying for inventory to getting cash on sale
- Can calculate from turnover ratios or periods
Microsoft’s 2017 cash conversion cycle: \(23.6 + 77.2 - 76.1 = 24.7\ days\)
Asset turnover
\[ \text{Asset turnover} = \frac{Net~revenue}{\frac{1}{2}\left(Assets_T + Assets_{T-1}\right)} \]
- Measures sales volume in relation to asset base
Microsoft’s 2017 asset turnover: \(\frac{89,950}{\frac{1}{2}\left(241,086+193,468)\right)}=41.4\%\)
Current ratio
\[ \frac{Current\ assets}{Current\ liabilities} \]
- Measures a company’s ability to pay current liabilities
- This should usually be \(>2\)
Microsoft’s 2017 current ratio: \(\frac{159,851}{64,527}=2.48\)
Quick ratio
\[ \frac{Cash + Short\ term\ investments + A/R}{Current\ liabilities} \]
- A.k.a. acid-test ratio
- Measures a company’s ability to pay current liabilities
- Only factors in liquid current assets
- This should be \(>1\)
Microsoft’s 2017 quick ratio: \(\frac{7,663 + 125,318 + 19,792}{64,527}=2.37\)
Debt ratio
\[ \frac{Total\ liabilities}{Total\ assets} \]
- A.k.a. Debt to assets ratio
- Measures a company’s leverage
- Leverage = how much the company is financed by debt
- Higher = more leverage = more debt financing
Microsoft’s 2017 debt ratio: \(\frac{168,692}{241,086}=70.0\%\)
Times-interest-earned ratio
\[ \frac{Income\ from\ operations}{Interest\ expense} \]
- Measures a company’s ability to cover interest payments
- Higher is better, \(<1\) should cause some worry
Microsoft’s 2017 times-interest-earned ratio: \(\frac{22,326}{2,222}=10.05\)
Practice
Calculate the following ratios for Microsoft in 2016
- Payable outstanding period
- Quick ratio
- Debt ratio
- Times-interest-earned ratio
Extra info: Microsoft’s A/P in 2015 was $6,591M
Solution
- Payable payment period (\(76.1\ days\) in 2017)
- \(365 / \frac{32,780}{\frac{1}{2}\left(6,898 + 6,591\right)}=75.1\ days\)
- Quick ratio (\(2.37\) in 2017)
- \(\frac{6,510 + 106,730 + 18,277}{59,357}=2.22\)
- Debt ratio (\(70.0\%\) in 2017)
- \(\frac{121,471}{193,468}=62.8\%\)
- Times-interest-earned ratio (\(10.5\) in 2017)
- \(\frac{20,182}{1,243}=16.2\)
Income statement ratios
Profit Margin
\[ \frac{Profit}{Revenue} \]
- Gross profit margin tells you about the company’s selling margins
- Operating profit margin tells you about its operating efficiency
- Net profit margin tells you about its overall profitability
Microsoft’s 2017 gross profit margin: \(\frac{55,689}{89,950}=61.9\%\)
Microsoft’s 2017 operating profit margin: \(\frac{22,326}{89,950}=24.8\%\)
Microsoft’s 2017 net profit margin: \(\frac{21,204}{89,950}=23.6\%\)
Return on assets (ROA)
\[ \frac{Net\ income}{\frac{1}{2}\left(Assets_T + Assets_{T-1}\right)} \]
- Measures overall profitability based on the company’s size
- Very common measure in practice
- Higher is better
Microsoft’s 2017 ROA: \(\frac{21,204}{\frac{1}{2}\left(241,086+193,468)\right)}=9.76\%\)
Return on equity (ROE)
\[ \frac{Net\ income}{\frac{1}{2}\left(Equity_T + Equity_{T-1}\right)} \]
- Measures overall profitability based on the company’s size
- Stockholder focussed
- Very common measure in practice
- Higher is better
Microsoft’s 2017 ROE: \(\frac{21,204}{\frac{1}{2}\left(72,394+71,997)\right)}=29.4\%\)
Practice
Calculate the following ratios for Microsoft in 2016
- Net profit margin
- Return on assets (ROA)
- Return on equity (ROE)
Extra info: Microsoft’s 2015 total assets was $176,223M and Microsoft’s 2015 total equity was $80,083M
Solution
- Net profit margin (\(23.6\%\) in 2017)
- \(\frac{16,798}{85,320}=19.7\%\)
- ROA (\(9.76\%\) in 2017)
- \(\frac{16,798}{\frac{1}{2}\left(193,468+176,223\right)}=9.09\%\)
- ROE (\(29.4\%\) in 2017)
- \(\frac{16,798}{\frac{1}{2}\left(71,997+80,083\right)}=22.1\%\)
Equity ratios
Earnings per share (EPS)
\[ \frac{Net\ income - Dividends\ on\ pref.\ shares}{\frac{1}{2}\left(\#Shares_T+\#Shares_{T-1}\right)} \]
- Measures the amount of profit tied to each share of stock
- Very common measure in practice
- Assume shares in year \(T\) and \(T-1\) are the same if not stated
- Very easily manipulated
Microsoft’s 2017 EPS: \(\frac{21,204 - 0}{\frac{1}{2}\left(7,708+7,808)\right)}=\$2.73/share\)
Price/earnings ratio (P/E ratio)
\[ \frac{Stock\ price}{EPS} \]
- A measure of if a stock is overpriced
- 6 to 8 is common, 20+ is common for tech firms
- Higher = overpriced
- Lower = underpriced
- Very common measure in practice
- Very easily manipulated, since EPS is easily manipulated
Microsoft’s 2017 P/E ratio: \(\frac{68.93}{2.73}=25.2\)
Practice
Calculate the following ratios for Microsoft in 2016
- EPS
- P/E Ratio
Extra info: Microsoft’s 2015 outstanding shares was 8,027M
Solution
- EPS (\(\$2.73/share\) in 2017)
- \(\frac{16,798 - 0}{\frac{1}{2}\left(7,808+8,027\right)} = \$2.12/share\)
- P/E Ratio (\(25.2\) in 2017)
- \(\frac{51.17}{2.12} = 24.1\)
Equations
Balance sheet ratio equations
\[ {\scriptsize \begin{align*} \text{Inventory turnover} &= \frac{COGS}{\frac{1}{2}\left(Inventory_T + Inventory_{T-1}\right)} \\ \text{A/R turnover} &= \frac{Revenue}{\frac{1}{2}\left(A/R_T + A/R_{T-1}\right)} \\ \text{A/P turnover} &= \frac{COGS}{\frac{1}{2}\left(A/P_T + A/P_{T-1}\right)}\\ \text{Cash conversion cyle} &= \frac{365}{Inv.\ turnover} + \frac{365}{A/R\ turnover} - \frac{365}{A/P\ turnover}\\ \text{Asset turnover} &= \frac{Net~revenue}{\frac{1}{2}\left(Assets_T + Assets_{T-1}\right)} \\ \text{Current ratio} &= \frac{Current\ assets}{Current\ liabilities} \\ \text{Quick ratio} &= \frac{Cash + Short\ term\ investments + A/R}{Current\ liabilities} \\ \text{Debt ratio} &= \frac{Total\ liabilities}{Total\ assets} \\ \text{Times-interest-earned} &= \frac{Income\ from\ operations}{Interest\ expense} \end{align*}} \]
Income statement ratio equations
\[ \scriptsize \begin{align*} \text{Gross (profit) margin} &= \frac{Gross\ profit}{Revenue} \\ \text{Operating profit margin} &= \frac{Operating\ profit}{Revenue} \\ \text{Net profit margin} &= \frac{Net\ income}{Revenue} \\ \text{Return on assets (ROA)} &= \frac{Net\ income}{\frac{1}{2}\left(Assets_T + Assets_{T-1}\right)} \\ \text{Return on equity (ROE)} &= \frac{Net\ income}{\frac{1}{2}\left(Equity_T + Equity_{T-1}\right)} \end{align*} \\ \]
Equity ratio equations
\[ \scriptsize \begin{align*} \text{Earnings per share (EPS)} &= \frac{Net\ income - Dividends\ on\ pref.\ shares}{\frac{1}{2}\left(\#Shares_T+\#Shares_{T-1}\right)} \\ \text{Price/earnings ratio (P/E)} &= \frac{Stock\ price}{EPS} \end{align*} \]
Analytics
Background
This is a quick preview of a module called “Forecasting and Forensic Analytics,” part of the Analytics major in SOA
- You don’t need to know this for this class, but the techniques covered here are becoming more and more important
Revenue prediction
Predicting ROA for tech companies using prior year data
##
## Call:
## lm(formula = ROA ~ ROA_lag + Revenue_lag + Debt_lag + factor(gind),
##     data = df_tech)
##
## Residuals:
##     Min      1Q  Median      3Q     Max
## -4.4421 -0.0238  0.0107  0.0467  0.4378
##
## Coefficients:
##                     Estimate Std. Error t value Pr(>|t|)
## (Intercept)         0.004095   0.031227   0.131  0.89569
## ROA_lag             0.469025   0.061576   7.617 6.91e-14 ***
## Revenue_lag         0.030639   0.015260   2.008  0.04498 *
## Debt_lag            0.121253   0.040732   2.977  0.00299 **
## factor(gind)451020 -0.092444   0.035630  -2.595  0.00964 **
## factor(gind)451030 -0.035024   0.033293  -1.052  0.29310
## factor(gind)452010 -0.138055   0.034286  -4.027 6.16e-05 ***
## factor(gind)452020 -0.077091   0.032478  -2.374  0.01784 *
## factor(gind)452030 -0.090377   0.034553  -2.616  0.00906 **
## factor(gind)453010 -0.014934   0.032090  -0.465  0.64178
## ---
## Signif. codes:  0 '***' 0.001 '**' 0.01 '*' 0.05 '.' 0.1 ' ' 1
##
## Residual standard error: 0.1827 on 851 degrees of freedom
##   (134 observations deleted due to missingness)
## Multiple R-squared:  0.1201, Adjusted R-squared:  0.1108
## F-statistic: 12.91 on 9 and 851 DF,  p-value: < 2.2e-16
Code: Revenue prediction
library(readr)
library(dplyr)
df <-read.csv("/media/Data/Data/Compustat/Compustat_199301-201703.csv")
df <- data.frame(df)
df_tech <- subset(df,gsector == 45 & at > 10000,
                  select=c("gvkey","datadate","at","ni","lt","revt","gind"))
df_tech <- arrange(df_tech, gvkey, datadate)
df_tech$ROA <- df_tech$ni / df_tech$at
df_tech$Revenue <- df_tech$revt / df_tech$at
df_tech$Debt <- df_tech$lt / df_tech$at
x <- c("ROA", "Revenue","Debt") # Columns to lag
df_tech <- df_tech %>%
  group_by(gvkey) %>%
  mutate_at(.cols=x, .funs=funs(lag = dplyr::lag(., n=1, default=NA)))
is.na(df_tech) <- sapply(df_tech, is.infinite)
fit <- lm(ROA ~ ROA_lag + Revenue_lag + Debt_lag + factor(gind), data=df_tech)
save(fit, file = "Data/fit.rda")
summary(fit)
Revenue prediction for Microsoft
Predict out Microsoft’s 2018 ROA
Code: Revenue prediction for Microsoft
df_ms <- subset(df,gvkey==12141, select=c("gvkey","datadate","at", "ni","lt",
                                          "revt","gind"))
df_ms2 <- data.frame(gvkey=12141, datadate=20170630, at=241086,ni=21204,
                     lt=168692,revt=89950,gind=451030)
df_ms3 <- data.frame(gvkey=12141, datadate=20180630, at=NA,ni=NA,
                     lt=NA,revt=NA,gind=451030)
df_ms <- rbind(df_ms, df_ms2, df_ms3)
df_ms$ROA <- df_ms$ni / df_ms$at
df_ms$Revenue <- df_ms$revt / df_ms$at
df_ms$Debt <- df_ms$lt / df_ms$at
x <- c("ROA", "Revenue","Debt") # Columns to lag
df_ms <- df_ms %>%
  group_by(gvkey) %>%
  mutate_at(.cols=x, .funs=funs(lag = dplyr::lag(., n=1, default=NA)))
df_ms$ROA_predicted <- predict(fit, df_ms)
df_ms$year = floor(df_ms$datadate/10000)
save(df_ms, file="Data/df_ms.rda")suppressPackageStartupMessages(library(plotly))
m <- list(l = 60, r = 50, b = 60, t = 100, pad = 4)
plot_ly(df_ms,x=~year,y=~ROA, name='Actual ROA', type='scatter',
mode='lines') %>%
add_trace(y=~ROA_predicted, name='Predicted ROA') %>%
layout(autosize = F, width = 800, height = 500, margin = m,
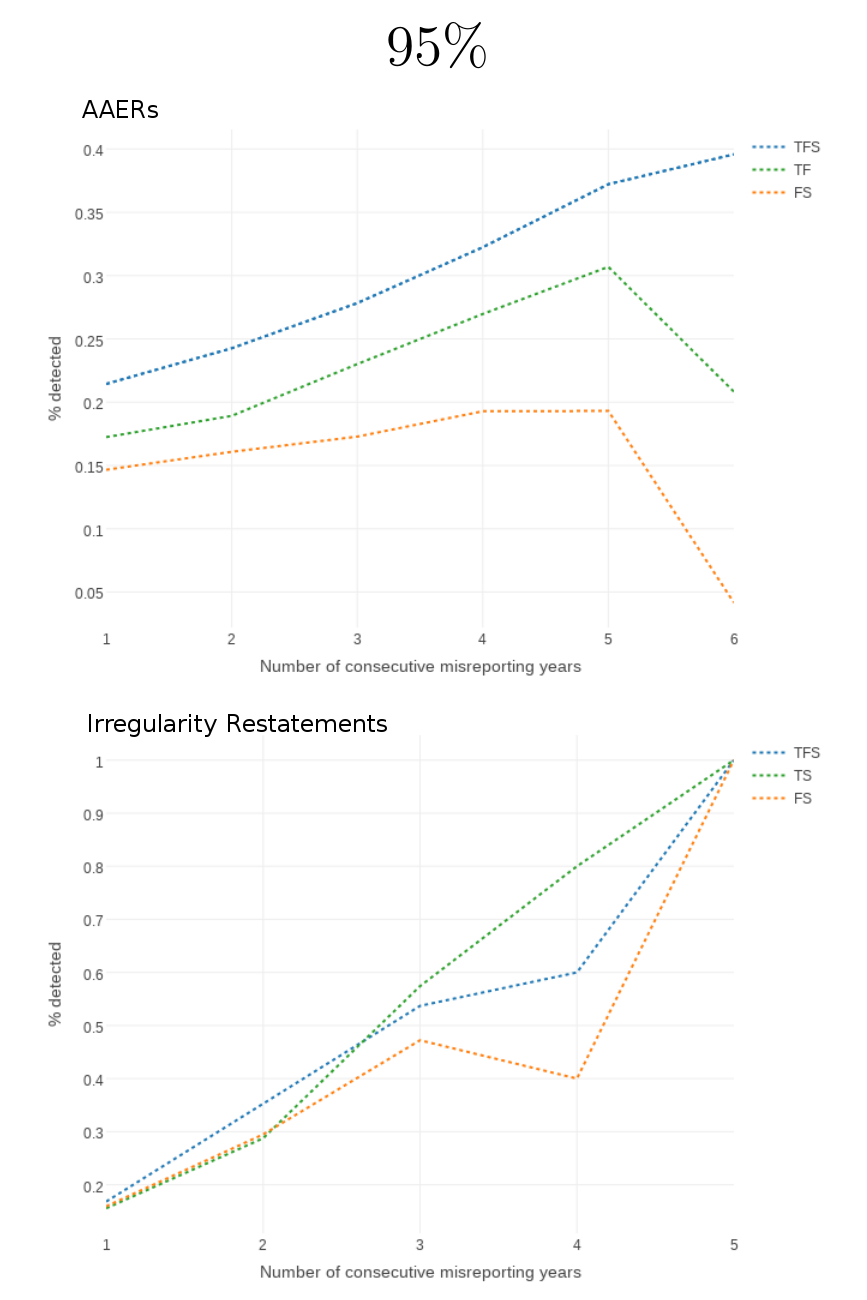
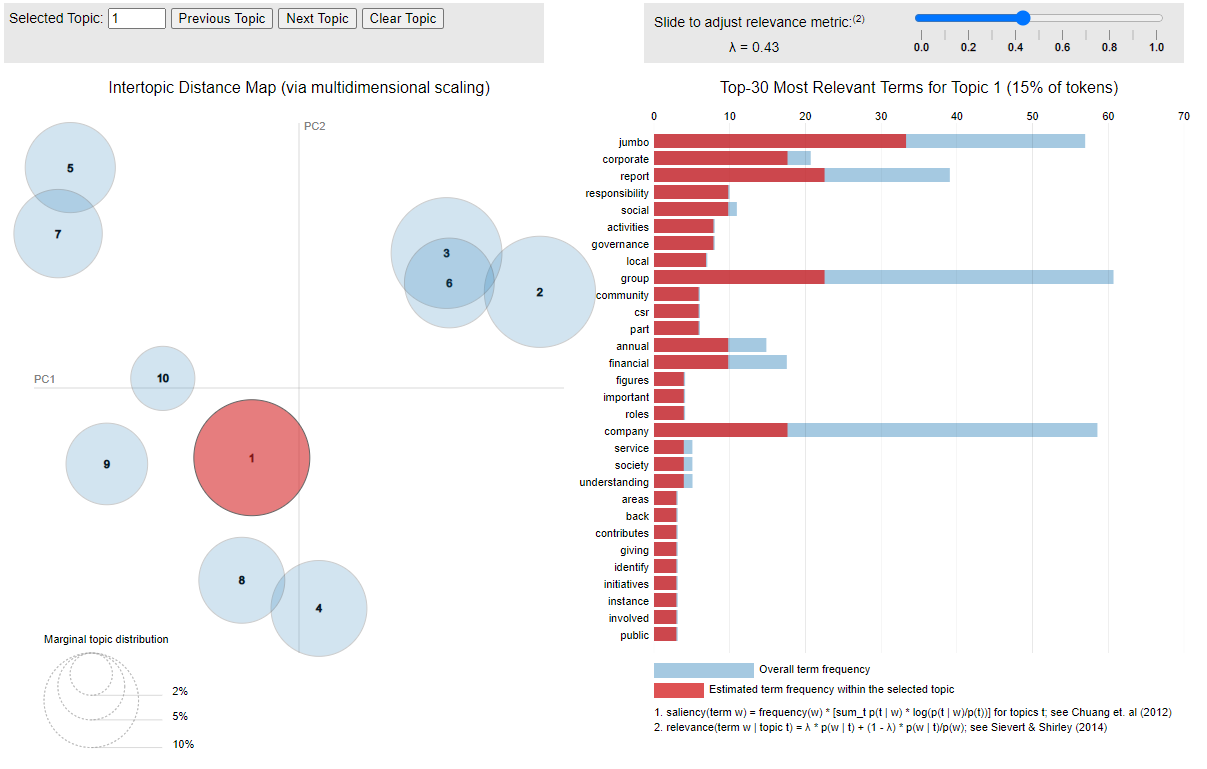
xaxis=list(title="Year"), yaxis=list(title="ROA"))Fraud detection
- Using 3 components:
- Topic – what companies say in annual reports
- Style – writing style used in annual reports
- Financials – financial ratios
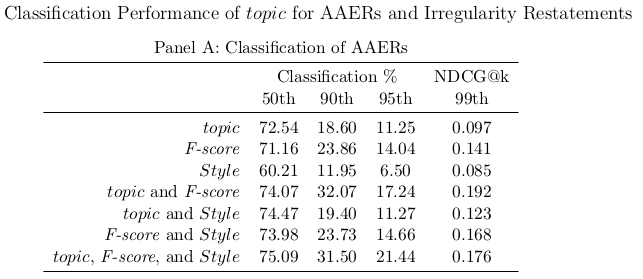
- Brown, Crowley, & Elliott 2019
Text classification of what you found interesting on HW2
End matter
For next week
- Homework 5
- Cash flows and financial ratios
- Turn in before next week
- Next week:
- Groups will present in order
- Group numbers were randomly assigned
- Group project presentations
- Email me slides by 10am of that class day
- Groups will present in order
- Extra practice available
- Financial ratios eLearn quiz
- Survey on the class session at rmc.link/101survey11
NOTES
Add in a slide on CCC with the usual diagram showing Inv->A/R->Cash vs A/P->Cash
- Animate this!
In the Financial Statement diagram, “gross margin” should be “gross profit”. Check other diagrams for this error too.
Consider adding:
- Debt to equity ratio
- Asset turnover
Consider removing:
- Book to market
- Dividend yield
- Operating profit margin
- Debt ratio
Print out the ratios in advance – too difficult to wing
To prep for analytics, play following link during break: