ACCT 420: Linear Regression
Session 2
Dr. Richard M. Crowley
Front matter
Learning objectives
- Theory:
- Develop a logical approach to problem solving with data
- Statistics
- Causation
- Hypothesis testing
- Develop a logical approach to problem solving with data
- Application:
- Predicting revenue for real estate firms
- Methodology:
- Univariate stats
- Linear regression
- Visualization
Datacamp
- For next week:
- Just 2 chapters:
- 1 on linear regression
- 1 on tidyverse methods
- Just 2 chapters:
- The full list of Datacamp materials for the course is up on eLearn
R Installation
- If you haven’t already, make sure to install R and R Studio!
- Instructions are in Session 1’s slides
- You will need it for this week’s assignment
- Please install a few packages using the following code
- These packages are also needed for the first assignment
- You are welcome to explore other packages as well, but those will not be necessary for now
- Assignments will be provided as R Markdown files
The format will generally all be filled out – you will just add to it, answer questions, analyze data, and explain your work. Instructions and hints are in the same file
R Markdown: A quick guide
- Headers and subheaders start with
#and##, respectively - Code blocks starts with
```{r}and end with```- By default, all code and figures will show up in the document
- Inline code goes in a block starting with
`rand ending with` - Italic font can be used by putting
*or_around text - Bold font can be used by putting
**around text- E.g.:
**bold text**becomes bold text
- E.g.:
- To render the document, click

- Math can be placed between
$to use LaTeX notation- E.g.
$\frac{revt}{at}$becomes \(\frac{revt}{at}\)
- E.g.
- Full equations (on their own line) can be placed between
$$ - A block quote is prefixed with
> - For a complete guide, see R Studio’s R Markdown::Cheat Sheet
Application: Revenue prediction
The question
How can we predict revenue for a company, leveraging data about that company, related companies, and macro factors
- Specific application: Real estate companies
More specifically…
- Can we use a company’s own accounting data to predict it’s future revenue?
- Can we use other companies’ accounting data to better predict all of their future revenue?
- Can we augment this data with macro economic data to further improve prediction?
- Singapore business sentiment data
Linear models
What is a linear model?
\[ \hat{y}=\alpha + \beta \hat{x} + \varepsilon \]
- The simplest model is trying to predict some outcome \(\hat{y}\) as a function of an input \(\hat{x}\)
- \(\hat{y}\) in our case is a firm’s revenue in a given year
- \(\hat{x}\) could be a firm’s assets in a given year
- \(\alpha\) and \(\beta\) are solved for
- \(\varepsilon\) is the error in the measurement
I will refer to this as an OLS model – Ordinary Least Square regression
Example
Let’s predict UOL’s revenue for 2016
- Compustat has data for them since 1989
- Complete since 1994
- Missing CapEx before that
- Complete since 1994
##       revt               at
##  Min.   :  94.78   Min.   : 1218
##  1st Qu.: 193.41   1st Qu.: 3044
##  Median : 427.44   Median : 3478
##  Mean   : 666.38   Mean   : 5534
##  3rd Qu.:1058.61   3rd Qu.: 7939
##  Max.   :2103.15   Max.   :19623
Linear models in R
- To run a linear model, use lm()
- The first argument is a formula for your model, where
~is used in place of an equals sign- The left side is what you want to predict
- The right side is inputs for prediction, separated by
+
- The second argument is the data to use
- The first argument is a formula for your model, where
- Additional variations for the formula:
- Functions transforming inputs (as vectors), such as
log() - Fully interacting variables using
*- I.e.,
A*Bincludes, A, B, and A times B in the model
- I.e.,
- Interactions using
:- I.e.,
A:Bjust includes A times B in the model
- I.e.,
- Functions transforming inputs (as vectors), such as
Example: UOL
##
## Call:
## lm(formula = revt ~ at, data = uol)
##
## Residuals:
##     Min      1Q  Median      3Q     Max
## -295.01 -101.29  -41.09   47.17  926.29
##
## Coefficients:
##               Estimate Std. Error t value Pr(>|t|)
## (Intercept) -13.831399  67.491305  -0.205    0.839
## at            0.122914   0.009678  12.701  6.7e-13 ***
## ---
## Signif. codes:  0 '***' 0.001 '**' 0.01 '*' 0.05 '.' 0.1 ' ' 1
##
## Residual standard error: 221.2 on 27 degrees of freedom
## Multiple R-squared:  0.8566, Adjusted R-squared:  0.8513
## F-statistic: 161.3 on 1 and 27 DF,  p-value: 6.699e-13
Why is it called Ordinary Least Squares?

Example: UOL
- This model wasn’t so interesting…
- Bigger firms have more revenue – this is a given
- How about… revenue growth?
- And change in assets
- i.e., Asset growth
\[ \Delta x_t = \frac{x_t}{x_{t-1}} - 1 \]
Calculating changes in R
- The easiest way is using tidyverse’s dplyr
- This has a lag() function
- The default way to do it is to create a vector manually
# tidyverse
uol <- uol %>%
  mutate(revt_growth1 = revt / lag(revt) - 1)

# R way
uol$revt_growth2 = uol$revt / c(NA, uol$revt[-length(uol$revt)]) - 1

identical(uol$revt_growth1, uol$revt_growth2)
## [1] TRUEYou can use whichever you are comfortable with
A note on mutate()
- mutate() adds variables to an existing data frame
- Also
mutate_all(),mutate_at(),mutate_if()mutate_all()applies a transformation to all values in a data frame and adds these to the data framemutate_at()does this for a set of specified variablesmutate_if()transforms all variables matching a condition- Such as
is.numeric
- Such as
- Also
- Mutate can be very powerful when making more complex variables
- For instance: Calculating growth within company in a multi-company data frame
Example: UOL with changes
# Make the other needed change
uol <- uol %>%
  mutate(at_growth = at / lag(at) - 1) %>%  # Calculate asset growth
  rename(revt_growth = revt_growth1)        # Rename for readability
# Run the OLS model
mod2 <- lm(revt_growth ~ at_growth, data = uol)
summary(mod2)
##
## Call:
## lm(formula = revt_growth ~ at_growth, data = uol)
##
## Residuals:
## Min 1Q Median 3Q Max
## -0.57736 -0.10534 -0.00953 0.15132 0.42284
##
## Coefficients:
## Estimate Std. Error t value Pr(>|t|)
## (Intercept) 0.09024 0.05620 1.606 0.1204
## at_growth 0.53821 0.27717 1.942 0.0631 .
## ---
## Signif. codes: 0 '***' 0.001 '**' 0.01 '*' 0.05 '.' 0.1 ' ' 1
##
## Residual standard error: 0.2444 on 26 degrees of freedom
## (1 observation deleted due to missingness)
## Multiple R-squared: 0.1267, Adjusted R-squared: 0.09307
## F-statistic: 3.771 on 1 and 26 DF, p-value: 0.06307Example: UOL with changes
- \(\Delta\)Assets doesn’t capture \(\Delta\)Revenue so well
- Perhaps change in total assets is a bad choice?
- Or perhaps we need to expand our model?
Scaling up!
\[ \hat{y}=\alpha + \beta_1 \hat{x}_1 + \beta_2 \hat{x}_2 + \ldots + \varepsilon \]
- OLS doesn’t need to be restricted to just 1 input!
- Not unlimited though (yet – we’ll get there)
- Number of inputs must be less than the number of observations minus 1
- Not unlimited though (yet – we’ll get there)
- Each \(\hat{x}_i\) is an input in our model
- Each \(\beta_i\) is something we will solve for
- \(\hat{y}\), \(\alpha\), and \(\varepsilon\) are the same as before
Scaling up our model
We have… 464 variables from Compustat Global alone!
- Let’s just add them all?
- We only have 28 observations…
- 28 << 464…
Now what?
Scaling up our model
Building a model requires careful thought!
- This is where having accounting and business knowledge comes in!
What makes sense to add to our model?
Practice: mutate()
- This practice is to make sure you understand how to use mutate with lags
- These are very important when dealing with business data!
- Do exercises 1 on today’s R practice file:
- R Practice
- Shortlink: rmc.link/420r2
Statistics Foundations
Frequentist statistics
A specific test is one of an infinite number of replications
- The “correct” answer should occur most frequently, i.e., with a high probability
- Focus on true vs false
- Treat unknowns as fixed constants to figure out
- Not random quantities
- Where it’s used
- Classical statistics methods
- Like OLS
- Classical statistics methods
Bayesian statistics
Focus on distributions and beliefs
- Prior distribution – what is believed before the experiment
- Posterior distribution: an updated belief of the distribution due to the experiment
- Derive distributions of parameters
- Where it’s used:
- Many machine learning methods
- Bayesian updating acts as the learning
- Bayesian statistics
- Many machine learning methods
A separate school of statistics thought
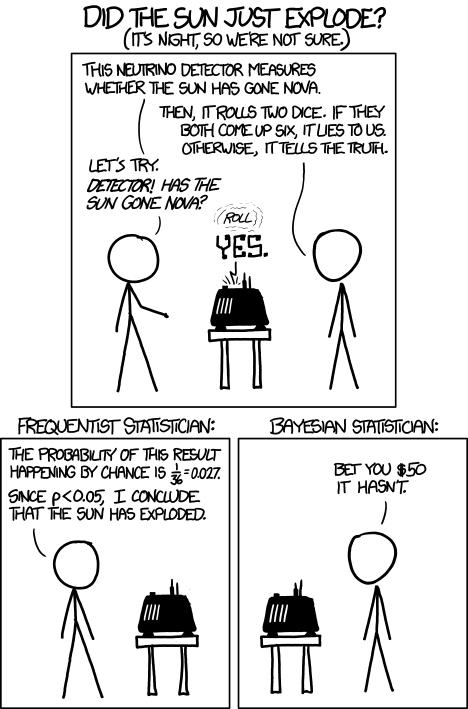
Frequentist vs Bayesian methods
This is why we use more than 1 data point
Frequentist perspective: Repeat the test
detector <- function() {
  dice <- sample(1:6, size=2, replace=TRUE)
  if (sum(dice) == 12) {
    "exploded"
  } else {
    "still there"
  }
}

experiment <- replicate(1000,detector())
# p value
p <- sum(experiment == "still there") / 1000
if (p < 0.05) {
  paste("p-value: ", p, "-- Fail to reject H_A, sun appears to have exploded")
} else {
  paste("p-value: ", p, "-- Reject H_A that sun exploded")
}
## [1] "p-value: 0.972 -- Reject H_A that sun exploded"Frequentist: The sun didn’t explode
Bayes persepctive: Bayes rule
\[ P(A|B) = \frac{P(B|A) P(A)}{P(B)} \]
- \(A\): The sun exploded
- \(B\): The detector said it exploded
- \(P(A)\): Really, really small. Say, ~0.
- \(P(B)\): \(\frac{1}{6}\times\frac{1}{6} = \frac{1}{36}\)
- \(P(B|A)\): \(\frac{35}{36}\)
\[ P(A|B) = \frac{P(B|A) P(A)}{P(B)} = \frac{\frac{35}{36}\times\sim 0}{\frac{1}{36}} = 35\times \sim 0 \approx 0 \]
Bayesian: The sun didn’t explode
What analytics typically relies on
- Regression approaches
- Most often done in a frequentist manner
- Can be done in a Bayesian manner as well
- Artificial Intelligence
- Often frequentist
- Sometimes neither – “It just works”
- Machine learning
- Sometimes Bayesian, sometime frequentist
- We’ll see both
We will use both to some extent – for our purposes, we will not debate the merits of either school of thought, but we will use tools derived from both
Confusion from frequentist approaches
- Possible contradictions:
- \(F\) test says the model is good yet nothing is statistically significant
- Individual \(p\)-values are good yet the model isn’t
- One measure says the model is good yet another doesn’t
There are many ways to measure a model, each with their own merits. They don’t always agree, and it’s on us to pick a reasonable measure.
Formalizing frequentist testing
Why formalize?
- Our current approach has been ad hoc
- What is our goal?
- How will we know if we have achieved it?
- Formalization provides more rigor
Scientific method
- Question
- What are we trying to determine?
- Hypothesis
- What do we think will happen? Build a model
- Prediction
- What exactly will we test? Formalize model into a statistical approach
- Testing
- Test the model
- Analysis
- Did it work?
Hypotheses
- Null hypothesis, a.k.a. \(H_0\)
- The status quo
- Typically: The model doesn’t work
- Alternative hypothesis, a.k.a. \(H_1\) or \(H_A\)
- The model does work (and perhaps how it works)
- Frequentist statistics can never directly support \(H_0\)!
- Only can fail to find support for \(H_A\)
- Even if our \(p\)-value is 1, we can’t say that the results prove the null hypothesis!
We will use test statistics to test the hypotheses
Regression
- Regression (like OLS) has the following assumptions
- The data is generated following some model
- E.g., a linear model
- In two weeks, a logistic model
- E.g., a linear model
- The data conforms to some statistical properties as required by the test
- The model coefficients are something to precisely determine
- I.e., the coefficients are constants
- \(p\)-values provide a measure of the chance of an error in a particular aspect of the model
- For instance, the p-value on \(\beta_1\) in \(y=\alpha + \beta_1 x_1 + \varepsilon\) essentially gives the probability that the sign of \(\beta_1\) is wrong
- The data is generated following some model
OLS Statistical properties
\[ \begin{align*} \text{Theory:}\quad y &= \alpha + \beta_1 x_1 + \beta_2 x_2 + \ldots + \varepsilon \\ \text{Data:}\quad \hat{y} &= \alpha + \beta_1 \hat{x}_1 + \beta_2 \hat{x}_2 + \ldots + \hat{\varepsilon} \end{align*} \]
- There should be a linear relationship between \(y\) and each \(x_i\)
- I.e., \(y\) is [approximated by] a constant multiple of each \(x_i\)
- Otherwise we shouldn’t use a linear regression
- Each \(\hat{x}_i\) is normally distributed
- Not so important with larger data sets, but a good to adhere to
- Each observation is independent
- We’ll violate this one for the sake of causality
- Homoskedasticity: Variance in errors is constant
- This is important
- Not too much multicollinearity
- Each \(\hat{x}_i\) should be relatively independent from the others
- Some is OK
Practical implications
Models designed under a frequentist approach can only answer the question of “does this matter?”
- Is this a problem?
Linear model implementation
What exactly is a linear model?
- Anything OLS is linear
- Many transformations can be recast to linear
- Ex.: \(log(y) = \alpha + \beta_1 x_1 + \beta_2 x_2 + \beta_3 {x_1}^2 + \beta_4 x_1 \cdot x_2\)
- This is the same as \(y' = \alpha + \beta_1 x_1 + \beta_2 x_2 + \beta_3 x_3 + \beta_4 x_4\) where:
- \(y' = log(y)\)
- \(x_3 = {x_1}^2\)
- \(x_4 = x_1 \cdot x_2\)
- This is the same as \(y' = \alpha + \beta_1 x_1 + \beta_2 x_2 + \beta_3 x_3 + \beta_4 x_4\) where:
- Ex.: \(log(y) = \alpha + \beta_1 x_1 + \beta_2 x_2 + \beta_3 {x_1}^2 + \beta_4 x_1 \cdot x_2\)
Linear models are very flexible
Mental model of OLS: 1 input

Simple OLS measures a simple linear relationship between an input and an output
- E.g.: Our first regression this week: Revenue on assets
Mental model of OLS: Multiple inputs
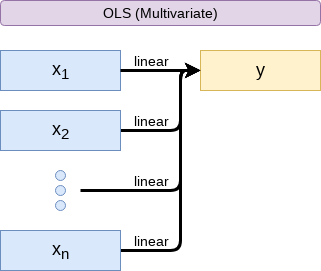
OLS measures simple linear relationships between a set of inputs and one output
- E.g.: This is what we did when scaling up earlier this session
Other linear models: IV Regression (2SLS)
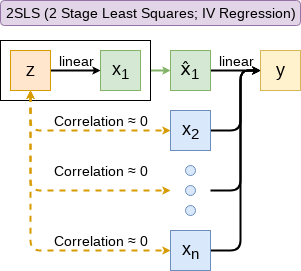
IV/2SLS models linear relationships where the effect of some \(x_i\) on \(y\) may be confounded by outside factors.
- E.g.: Modeling the effect of management pay duration (like bond duration) on firms’ choice to issue earnings forecasts
- Instrument with CEO tenure (Cheng, Cho, and Kim 2015)
Other linear models: SUR
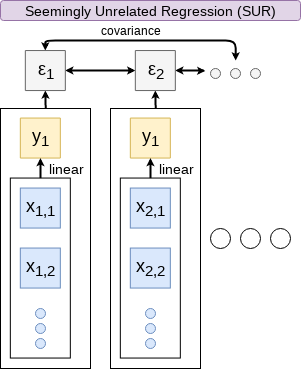
SUR models systems with related error terms
- E.g.: Modeling both revenue and earnings simultaneously
Other linear models: 3SLS
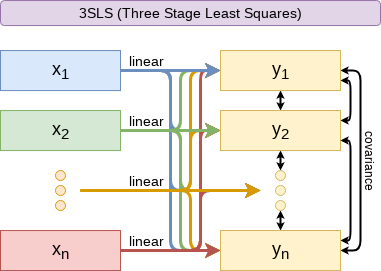
3SLS models systems of equations with related outputs
- E.g.: Modeling stock return, volatility, and volume simultaneously
Other linear models: SEM
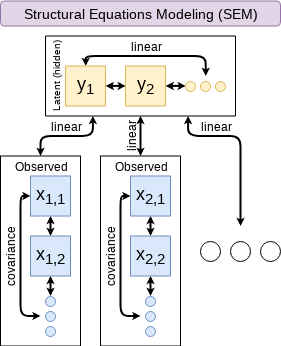
SEM can model abstract and multi-level relationships
- E.g.: Showing that organizational commitment leads to higher job satisfaction, not the other way around (Poznanski and Bline 1999)
Modeling choices: Model selection
Pick what fits your problem!
- For forecasting a quantity:
- Usually some sort of linear model regressed using OLS
- The other model types mentioned are great for simultaneous forecasting of multiple outputs
- For forecasting a binary outcome:
- Usually logit or a related model (we’ll start this in 2 weeks)
- For forensics:
- Usually logit or a related model
There are many more model types though!
Modeling choices: Variable selection
- The options:
- Use your own knowledge to select variables
- Use a selection model to automate it
Own knowledge
- Build a model based on your knowledge of the problem and situation
- This is generally better
- The result should be more interpretable
- For prediction, you should know relationships better than most algorithms

Modeling choices: Automated selection
- Traditional methods include:
- Forward selection: Start with nothing and add variables with the most contribution to Adj \(R^2\) until it stops going up
- Backward selection: Start with all inputs and remove variables with the worst (negative) contribution to Adj \(R^2\) until it stops going up
- Stepwise selection: Like forward selection, but drops non-significant predictors
- Newer methods:
- Lasso and Elastic Net based models
- Optimize with high penalties for complexity (i.e., # of inputs)
- We will discuss these in week 5
- Lasso and Elastic Net based models

The overfitting problem
Or: Why do we like simpler models so much?
- Overfitting happens when a model fits in-sample data too well…
- To the point where it also models any idiosyncrasies or errors in the data
- This harms prediction performance
- Directly harming our forecasts
An overfitted model works really well on its own data, and quite poorly on new data
Statistical tests and Interpretation
Coefficients
- In OLS: \(\beta_i\)
- A change in \(x_i\) by 1 leads to a change in \(y\) by \(\beta_i\)
- Essentially, the slope between \(x\) and \(y\)
- The blue line in the chart is the regression line for \(\hat{Revenue} = \alpha + \beta_i \hat{Assets}\) for retail firms since 1960

P-values
- \(p\)-values tell us the probability that an individual result is due to random chance
“The P value is defined as the probability under the assumption of no effect or no difference (null hypothesis), of obtaining a result equal to or more extreme than what was actually observed.”
– Dahiru 2008
- These are very useful, particularly for a frequentist approach
- First used in the 1700s, but popularized by Ronald Fisher in the 1920s and 1930s
P-values: Rule of thumb
- If \(p<0.05\) and the coefficient sign matches our mental model, we can consider this as supporting our model
- If \(p<0.05\) but the coefficient is opposite, then it is suggesting a problem with our model
- If \(p>0.10\), it is rejecting the alternative hypothesis
- If \(0.05 < p < 0.10\) it depends…
- For a small dataset or a complex problem, we can use \(0.10\) as a cutoff
- For a huge dataset or a simple problem, we should use \(0.05\)
- We may even set a lower threshold if we have a ton of data
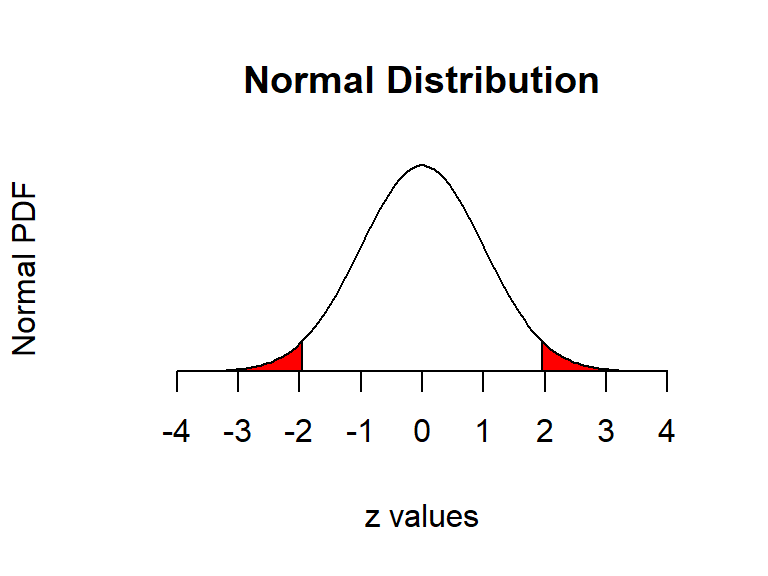
One vs two tailed tests
- Best practice:
- Use a two tailed test
- Second best practice:
- If you use a 1-tailed test, use a p-value cutoff of 0.025 or 0.05
- This is equivalent to the best practice, just roundabout
- If you use a 1-tailed test, use a p-value cutoff of 0.025 or 0.05
- Common but generally inappropriate:
- Use a one tailed test with cutoffs of 0.05 or 0.10 because your hypothesis is directional
\(R^2\)
- \(R^2\) = Explained variation / Total variation
- Variation = difference in the observed output variable from its own mean
- A high \(R^2\) indicates that the model fits the data very well
- A low \(R^2\) indicates that the model is missing much of the variation in the output
- \(R^2\) is technically a biased estimator
- Adjusted \(R^2\) downweights \(R^2\) and makes it unbiased
- \(R^2_{Adj} = P R^2 + 1 - P\)
- Where \(P=\frac{n-1}{n-p-1}\)
- \(n\) is the number of observations
- \(p\) is the number of inputs in the model
- \(R^2_{Adj} = P R^2 + 1 - P\)
Test statistics
- Testing a coefficient:
- Use a \(t\) or \(z\) test
- Testing a model as a whole
- \(F\)-test, check adjusted R squared as well
- Testing across models
- Chi squared (\(\chi^2\)) test
- Vuong test (comparing \(R^2\))
- Akaike Information Criterion (AIC) (Comparing MLEs, lower is better)
All of these have p-values, except for AIC
Causality
What is causality?
\(A \rightarrow B\)
- Causality is \(A\) causing \(B\)
- This means more than \(A\) and \(B\) are correlated
- I.e., If \(A\) changes, \(B\) changes. But \(B\) changing doesn’t mean \(A\) changed
- Unless \(B\) is 100% driven by \(A\)
- Very difficult to determine, particularly for events that happen [almost] simultaneously
- Examples of correlations that aren’t causation
Time and causality
\(A \rightarrow B\) or \(A \leftarrow B\)?
\(A_t \rightarrow B_{t+1}\)
- If there is a separation in time, it’s easier to say \(A\) caused \(B\)
- Observe \(A\), then see if \(B\) changes after
- Conveniently, we have this structure when forecasting
- Consider a model like:
\[ Revenue_{t+1} = Revenue_t + \ldots \]
Time and causality break down
\(A_t \rightarrow B_{t+1}\)? \(\quad\) OR \(\quad\) \(C \rightarrow A_t\) and \(C \rightarrow B_{t+1}\)?
- The above illustrates the Correlated omitted variable problem
- \(A\) doesn’t cause \(B\)… Instead, some other force \(C\) causes both
- The bane of social scientists everywhere
- This is less important for predictive analytics, as we care more about performance, but…
- It can complicate interpreting your results
- Figuring out \(C\) can help improve you model’s predictions
- So find C!
Revisiting the previous problem
Formalizing our last test
- Question
- \(~\)
- Hypotheses
- \(H_0\):
- \(H_1\):
- Prediction
- \(~\)
- Testing:
- \(~\)
- Statistical tests:
- Individual variables:
- Model:
Is this model better?
## Analysis of Variance Table
##
## Model 1: revt_growth ~ at_growth
## Model 2: revt_growth ~ lct_growth + che_growth + ebit_growth
##   Res.Df    RSS Df Sum of Sq Pr(>Chi)
## 1     26 1.5534
## 2     24 1.1918  2   0.36168   0.0262 *
## ---
## Signif. codes:  0 '***' 0.001 '**' 0.01 '*' 0.05 '.' 0.1 ' ' 1
A bit better at \(p<0.05\)
- This means our model with change in current liabilities, cash, and EBIT appears to be better than the model with change in assets.
Panel data
Expanding our methodology
- Why should we limit ourselves to 1 firm’s data?
- The nature of data analysis is such:
Adding more data usually helps improve predictions
- Assuming:
- The data isn’t of low quality (too noisy)
- The data is relevant
- Any differences can be reasonably controlled for
Expanding our question
- Previously: Can we predict revenue using a firm’s accounting information?
- This is simultaneous, and thus is not forecasting
- Now: Can we predict future revenue using a firm’s accounting information?
- By trying to predict ahead, we are now in the realm of forecasting
- What do we need to change?
- \(\hat{y}\) will need to be 1 year in the future
First things first
- When using a lot of data, it is important to make sure the data is clean
- In our case, we may want to remove any very small firms
# Ensure firms have at least $1M (local currency), and have revenue
# df contains all real estate companies excluding North America
df_clean <- df %>%
  filter(at>1, revt>0)

# We cleaned out 578 observations!
print(c(nrow(df), nrow(df_clean)))
## [1] 5161 4583Looking back at the prior models
uol <- uol %>% mutate(revt_lead = lead(revt))  # From dplyr
forecast1 <- lm(revt_lead ~ lct + che + ebit, data=uol)
library(broom)  # Lets us view bigger regression outputs in a tidy fashion
tidy(forecast1)  # Present regression output
## # A tibble: 4 x 5
## term estimate std.error statistic p.value
## <chr> <dbl> <dbl> <dbl> <dbl>
## 1 (Intercept) 87.4 124. 0.707 0.486
## 2 lct 0.213 0.291 0.731 0.472
## 3 che 0.112 0.349 0.319 0.752
## 4 ebit 2.49 1.03 2.42 0.0236## # A tibble: 1 x 12
## r.squared adj.r.squared sigma statistic p.value df logLik AIC BIC
## <dbl> <dbl> <dbl> <dbl> <dbl> <dbl> <dbl> <dbl> <dbl>
## 1 0.655 0.612 357. 15.2 9.39e-6 3 -202. 414. 421.
## # ... with 3 more variables: deviance <dbl>, df.residual <int>, nobs <int>This model is ok, but we can do better.
Expanding the prior model
## # A tibble: 7 x 5
##   term        estimate std.error statistic p.value
##   <chr>          <dbl>     <dbl>     <dbl>   <dbl>
## 1 (Intercept)  15.6       97.0       0.161 0.874
## 2 revt          1.49       0.414     3.59  0.00174
## 3 act           0.324      0.165     1.96  0.0629
## 4 che           0.0401     0.310     0.129 0.898
## 5 lct          -0.198      0.179    -1.10  0.283
## 6 dp            3.63       5.42      0.669 0.511
## 7 ebit -3.57 1.36 -2.62 0.0161- Revenue to capture stickiness of revenue
- Current assest & Cash (and equivalents) to capture asset base
- Current liabilities to capture payments due
- Depreciation to capture decrease in real estate asset values
- EBIT to capture operational performance
Expanding the prior model
## # A tibble: 1 x 12
##   r.squared adj.r.squared sigma statistic p.value    df logLik   AIC   BIC
##       <dbl>         <dbl> <dbl>     <dbl>   <dbl> <dbl>  <dbl> <dbl> <dbl>
## 1     0.903         0.875  203.      32.5 1.41e-9     6  -184.  385.  396.
## # ... with 3 more variables: deviance <dbl>, df.residual <int>, nobs <int>## Analysis of Variance Table
##
## Model 1: revt_lead ~ lct + che + ebit
## Model 2: revt_lead ~ revt + act + che + lct + dp + ebit
## Res.Df RSS Df Sum of Sq Pr(>Chi)
## 1 24 3059182
## 2 21 863005 3 2196177 1.477e-11 ***
## ---
## Signif. codes: 0 '***' 0.001 '**' 0.01 '*' 0.05 '.' 0.1 ' ' 1This is better (Adj. \(R^2\), \(\chi^2\), AIC).
Panel data
- Panel data refers to data with the following characteristics:
- There is a time dimension
- There is at least 1 other dimension to the data (firm, country, etc.)
- Special cases:
- A panel where all dimensions have the same number of observations is called balanced
- Otherwise we call it unbalanced
- A panel missing the time dimension is cross-sectional
- A panel missing the other dimension(s) is a time series
- A panel where all dimensions have the same number of observations is called balanced
- Format:
- Long: Indexed by all dimensions
- Wide: Indexed only by some dimensions
Panel data
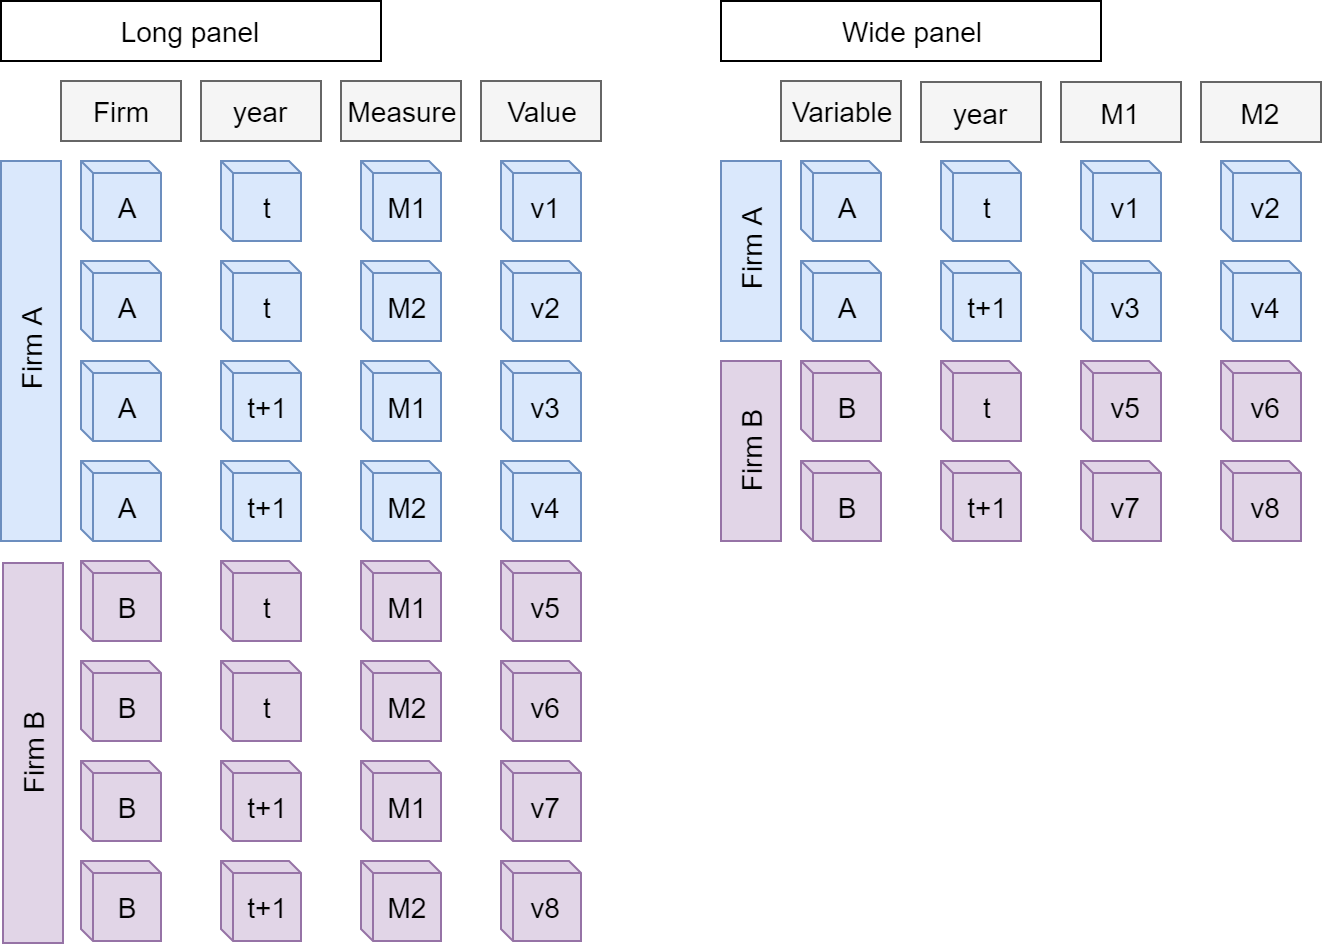
Data frames are usually wide panels
All Singapore real estate companies
# Note the group_by -- without it, lead() will pull from the subsequent firm!
# ungroup() tells R that we finished grouping
df_clean <- df_clean %>%
  group_by(isin) %>%
  mutate(revt_lead = lead(revt)) %>%
  ungroup()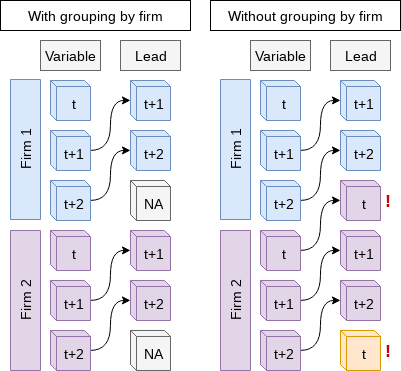
All Singapore real estate companies
forecast3 <-
  lm(revt_lead ~ revt + act + che + lct + dp + ebit,
     data=df_clean[df_clean$fic=="SGP",])
tidy(forecast3)
## # A tibble: 7 x 5
## term estimate std.error statistic p.value
## <chr> <dbl> <dbl> <dbl> <dbl>
## 1 (Intercept) 25.0 13.2 1.89 5.95e- 2
## 2 revt 0.505 0.0762 6.63 1.43e-10
## 3 act -0.0999 0.0545 -1.83 6.78e- 2
## 4 che 0.494 0.155 3.18 1.62e- 3
## 5 lct 0.396 0.0860 4.60 5.95e- 6
## 6 dp 4.46 1.55 2.88 4.21e- 3
## 7 ebit -0.951 0.271 -3.51 5.18e- 4All Singapore real estate companies
## # A tibble: 1 x 12
##   r.squared adj.r.squared sigma statistic   p.value    df logLik   AIC   BIC
##       <dbl>         <dbl> <dbl>     <dbl>     <dbl> <dbl>  <dbl> <dbl> <dbl>
## 1     0.844         0.841  210.      291. 2.63e-127     6 -2237. 4489. 4519.
## # ... with 3 more variables: deviance <dbl>, df.residual <int>, nobs <int>
Lower adjusted \(R^2\) – This is worse? Why?
- Note: \(\chi^2\) can only be used for models on the same data
- Same for AIC
Worldwide real estate companies
## # A tibble: 7 x 5
##   term         estimate std.error statistic  p.value
##   <chr>           <dbl>     <dbl>     <dbl>    <dbl>
## 1 (Intercept) 222.      585.          0.379 7.04e- 1
## 2 revt          0.997     0.00655   152.    0.
## 3 act          -0.00221   0.00547    -0.403 6.87e- 1
## 4 che          -0.150     0.0299     -5.02  5.36e- 7
## 5 lct           0.0412    0.0113      3.64  2.75e- 4
## 6 dp            1.52      0.184       8.26  1.89e-16
## 7 ebit          0.308     0.0650      4.74  2.25e- 6
Worldwide real estate companies
## # A tibble: 1 x 12
##   r.squared adj.r.squared  sigma statistic p.value    df  logLik    AIC    BIC
##       <dbl>         <dbl>  <dbl>     <dbl>   <dbl> <dbl>   <dbl>  <dbl>  <dbl>
## 1     0.944         0.944 36459.    11299.       0     6 -47819. 95654. 95705.
## # ... with 3 more variables: deviance <dbl>, df.residual <int>, nobs <int>
Higher adjusted \(R^2\) – better!
- Note: \(\chi^2\) can only be used for models on the same data
- Same for AIC
Model accuracy
Why is the UOL model better than the Singapore model?
- Ranking:
- Worldwide real estate model
- UOL model
- Singapore real estate model
Practice: group_by()
- This practice is to make sure you understand how to use mutate with leads and lags when there are multiple companies in the data
- We’ll almost always work with multiple companies!
- Do exercises 2 and 3 on today’s R practice file:
- R Practice
- Shortlink: rmc.link/420r2
Dealing with noise
Noise
Statistical noise is random error in the data
- Many sources of noise:
- Other factors not included in
- Error in measurement
- Accounting measurement!
- Unexpected events / shocks
Noise is OK, but the more we remove, the better!
Removing noise: Singapore model
- Different companies may behave slightly differently
- Control for this using a Fixed Effect
- Note: ISIN uniquely identifies companies
forecast3.1 <-
  lm(revt_lead ~ revt + act + che + lct + dp + ebit + factor(isin),
     data=df_clean[df_clean$fic=="SGP",])
# n=7 to prevent outputting every fixed effect
print(tidy(forecast3.1), n=15)
## # A tibble: 27 x 5
## term estimate std.error statistic p.value
## <chr> <dbl> <dbl> <dbl> <dbl>
## 1 (Intercept) 1.58 39.4 0.0401 0.968
## 2 revt 0.392 0.0977 4.01 0.0000754
## 3 act -0.0538 0.0602 -0.894 0.372
## 4 che 0.304 0.177 1.72 0.0869
## 5 lct 0.392 0.0921 4.26 0.0000276
## 6 dp 4.71 1.73 2.72 0.00687
## 7 ebit -0.851 0.327 -2.60 0.00974
## 8 factor(isin)SG1AA6000000 218. 76.5 2.85 0.00463
## 9 factor(isin)SG1AD8000002 -11.7 67.4 -0.174 0.862
## 10 factor(isin)SG1AE2000006 4.02 79.9 0.0503 0.960
## 11 factor(isin)SG1AG0000003 -13.6 61.1 -0.223 0.824
## 12 factor(isin)SG1BG1000000 -0.901 69.5 -0.0130 0.990
## 13 factor(isin)SG1BI9000008 7.76 64.3 0.121 0.904
## 14 factor(isin)SG1DE5000007 -10.8 61.1 -0.177 0.860
## 15 factor(isin)SG1EE1000009 -6.90 66.7 -0.103 0.918
## # ... with 12 more rowsRemoving noise: Singapore model
## # A tibble: 1 x 12
##   r.squared adj.r.squared sigma statistic   p.value    df logLik   AIC   BIC
##       <dbl>         <dbl> <dbl>     <dbl>     <dbl> <dbl>  <dbl> <dbl> <dbl>
## 1     0.856         0.844  208.      69.4 1.15e-111    26 -2223. 4502. 4609.
## # ... with 3 more variables: deviance <dbl>, df.residual <int>, nobs <int>## Analysis of Variance Table
##
## Model 1: revt_lead ~ revt + act + che + lct + dp + ebit
## Model 2: revt_lead ~ revt + act + che + lct + dp + ebit + factor(isin)
## Res.Df RSS Df Sum of Sq Pr(>Chi)
## 1 324 14331633
## 2 304 13215145 20 1116488 0.1765This isn’t much different. Why? There is another source of noise within Singapore real estate companies
Another way to do fixed effects
- The library lfe has felm(): fixed effects linear model
- Better for complex models
- Doesn’t support prediction natively though
library(lfe)
forecast3.2 <-
  felm(revt_lead ~ revt + act + che + lct + dp + ebit | factor(isin),
       data=df_clean[df_clean$fic=="SGP",])
summary(forecast3.2)
##
## Call:
## felm(formula = revt_lead ~ revt + act + che + lct + dp + ebit | factor(isin), data = df_clean[df_clean$fic == "SGP", ])
##
## Residuals:
## Min 1Q Median 3Q Max
## -1181.88 -23.25 -1.87 18.03 1968.86
##
## Coefficients:
## Estimate Std. Error t value Pr(>|t|)
## revt 0.39200 0.09767 4.013 7.54e-05 ***
## act -0.05382 0.06017 -0.894 0.37181
## che 0.30370 0.17682 1.718 0.08690 .
## lct 0.39209 0.09210 4.257 2.76e-05 ***
## dp 4.71275 1.73168 2.721 0.00687 **
## ebit -0.85080 0.32704 -2.602 0.00974 **
## ---
## Signif. codes: 0 '***' 0.001 '**' 0.01 '*' 0.05 '.' 0.1 ' ' 1
##
## Residual standard error: 208.5 on 304 degrees of freedom
## (29 observations deleted due to missingness)
## Multiple R-squared(full model): 0.8558 Adjusted R-squared: 0.8435
## Multiple R-squared(proj model): 0.7806 Adjusted R-squared: 0.7618
## F-statistic(full model):69.41 on 26 and 304 DF, p-value: < 2.2e-16
## F-statistic(proj model): 180.3 on 6 and 304 DF, p-value: < 2.2e-16Why exactly would we use fixed effects?
- Fixed effects are used when the average of \(\hat{y}\) varies by some group in our data
- In our problem, the average revenue of each firm is different
- Fixed effects absorb this difference

- Further reading:
- Introductory Econometrics by Jeffrey M. Wooldridge

What else can we do?
What else could we do to improve our prediction model?
- Assuming:
- We do not have access to international data
- We do have access to Singaporean firms’ data
- We have access to any data that is publicly available
End matter
For next week
- For next week:
- 2 chapters on Datacamp
- First individual assignment
- Do this one individually!
- Turn in on eLearn before class in 2 weeks
Packages used for these slides
Custom code
# Graph showing squared error (slide 4.6)
uolg <- uol[,c("at","revt")]
uolg$resid <- mod1$residuals
uolg$xleft <- ifelse(uolg$resid < 0,uolg$at,uolg$at - uolg$resid)
uolg$xright <- ifelse(uolg$resid < 0,uolg$at - uolg$resid, uol$at)
uolg$ytop <- ifelse(uolg$resid < 0,uolg$revt - uolg$resid,uol$revt)
uolg$ybottom <- ifelse(uolg$resid < 0,uolg$revt, uolg$revt - uolg$resid)
uolg$point <- TRUE

uolg2 <- uolg
uolg2$point <- FALSE
uolg2$at <- ifelse(uolg$resid < 0,uolg2$xright,uolg2$xleft)
uolg2$revt <- ifelse(uolg$resid < 0,uolg2$ytop,uolg2$ybottom)

uolg <- rbind(uolg, uolg2)

uolg %>% ggplot(aes(y=revt, x=at, group=point)) +
         geom_point(aes(shape=point)) +
         scale_shape_manual(values=c(NA,18)) +
         geom_smooth(method="lm", se=FALSE) +
         geom_errorbarh(aes(xmax=xright, xmin = xleft)) +
         geom_errorbar(aes(ymax=ytop, ymin = ybottom)) +
         theme(legend.position="none")
# Chart of mean revt_lead for Singaporean firms (slide 12.6)
df_clean %>% # Our data frame
filter(fic=="SGP") %>% # Select only Singaporean firms
group_by(isin) %>% # Group by firm
mutate(mean_revt_lead=mean(revt_lead, na.rm=T)) %>% # Determine each firm's mean revenue (lead)
slice(1) %>% # Take only the first observation for each group
ungroup() %>% # Ungroup (we don't need groups any more)
ggplot(aes(x=mean_revt_lead)) + # Initialize plot and select data
geom_histogram(aes(y = ..density..)) + # Plots the histogram as a density so that geom_density is visible
geom_density(alpha=.4, fill="#FF6666") # Plots smoothed density 