
What are You Saying? Using Topic to Detect Financial Misreporting, 2018
Abstract: This study uses a machine learning technique to assess whether the thematic content of financial statement disclosures (labeled as topic) is incrementally informative in predicting intentional misreporting. Using a Bayesian topic modeling algorithm, we determine and empirically quantify the topic content of a large collection of 10-K narratives spanning the 1994 to 2012 period. We find that the algorithm produces a valid set of semantically meaningful topics that are predictive of financial misreporting based on samples of SEC enforcement actions (AAERs) and irregularity restatements arising from intentional GAAP violations. Our out-of-sample tests indicate that topic significantly improves the detection of financial misreporting when added to models based on commonly-used financial and textual style variables. Furthermore, we find that models including topic outperform traditional models when predicting long-duration misstatements. These results are robust to alternative topic definitions and regression specifications and various controls for firms with repeated instances of financial misreporting.
A copy of the paper is available at SSRN:

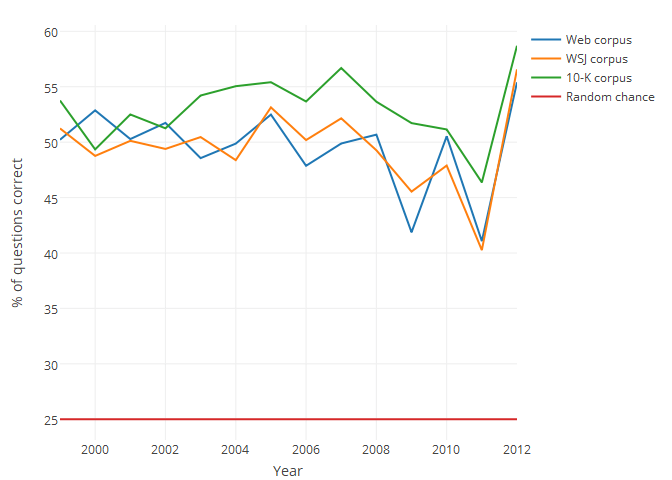
This paper also includes an experimental validation of the Latent Dirichlet Allocation (LDA) algorithm applied to accounting information. Details of this are contained in the web appendix of the paper. This was done using a word intrusion task — i.e., 3 words from one topic generated by LDA are chosen, and a 4th word picked from another topic is added in. Then, the task is for someone else to determine which word doesn’t belong. The task was run as a lab experiment on individuals on Amazon Turk, where the individuals where significantly better than random chance at identifying the intruding word. A full battery of over 12M questions were also posed to word2vec and GloVe algorithms, where they performed better than chance (25%) in all 5 year windows studied in the paper, as shown in the graph below. In the graph, the year indicate the year after a window ends; i.e., 1999 indicates an LDA algorithm trained over annual reports from 1994 through 1998.
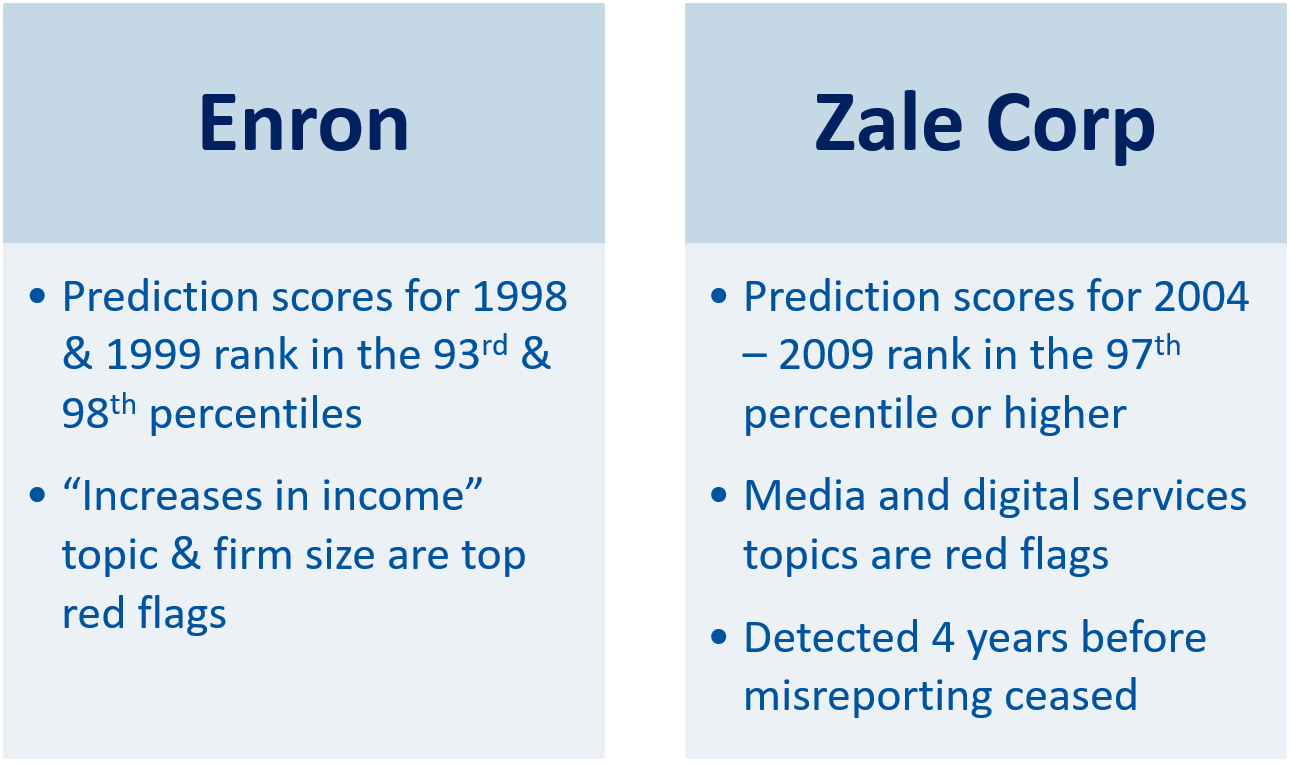
Lastly, a couple of case studies are included below, which illustrate the effectiveness of the algortihm: